
Filter by
The language used throughout the course, in both instruction and assessments.
812 results for "graph analytics"
Coursera Project Network
Skills you'll gain: Data Analysis, Data Visualization, Javascript

Skills you'll gain: Data Analysis, Business Analysis, Data Management, Data Visualization, Microsoft Excel, Data Analysis Software, Spreadsheet Software, Problem Solving, Statistical Analysis, Interactive Data Visualization, Data Structures, Financial Analysis, Statistical Visualization, Extract, Transform, Load, Data Model, Data Visualization Software, Exploratory Data Analysis, General Statistics, Big Data, Critical Thinking, Professional Development, Decision Making, Communication, Business Communication, Storytelling, Business Process Management, Forecasting, Visual Design, Planning

Google Cloud
Skills you'll gain: Collaboration, Google Cloud Platform, Cloud Applications, Communication, User Experience, Leadership and Management, Cloud Platforms, Cloud Computing, Business Communication, Organizational Development, Google App Engine, Cloud Storage, Data Management, Planning, Problem Solving, Business Analysis, Spreadsheet Software, Business Process Management, Other Cloud Platforms and Tools, Project Management, Writing, Professional Development, Data Analysis, Strategy, Exploratory Data Analysis, Design and Product, Visual Design, Graphic Design

Skills you'll gain: Computer Programming, Data Analysis, Data Visualization, Exploratory Data Analysis, General Statistics, Machine Learning, Machine Learning Algorithms, Plot (Graphics), Probability & Statistics, Python Programming, Regression
University of Toronto
Skills you'll gain: ArcGIS, Data Analysis, Data Visualization, Geovisualization, Spatial Analysis, Spatial Data Analysis, GIS Software, Data Analysis Software, Data Visualization Software, Data Model, Data Management, Databases, Statistical Analysis, Mergers & Acquisitions
 Status: Free
Knowledge Accelerators
Skills you'll gain: Data Analysis, Data Model, Data Visualization, Microsoft Excel, Power BI

Skills you'll gain: Business Intelligence, Data Model, Data Visualization, Tableau Software

Google Cloud
Skills you'll gain: Google Cloud Platform, Cloud Computing, SQL, Databases, Data Analysis, Big Data, Cloud Platforms, Data Management, Exploratory Data Analysis, Cloud Storage, Data Analysis Software, Machine Learning, Applied Machine Learning, Human Learning, Data Visualization, Machine Learning Algorithms, Machine Learning Software, Database Theory

California Institute of the Arts
Skills you'll gain: Front-End Web Development, Interactive Design, User Experience, User Experience Design, Visual Design, Visualization (Computer Graphics), Web Design

Icahn School of Medicine at Mount Sinai
Skills you'll gain: Bioinformatics, Probability & Statistics, Mathematics, Differential Equations, Network Analysis, Graph Theory, Matlab

University of Colorado Boulder
Skills you'll gain: Mathematics, Algebra, Calculus, Linear Algebra, Mathematical Theory & Analysis, Differential Equations, Plot (Graphics), Problem Solving, Applied Mathematics, Graph Theory

Microsoft
Skills you'll gain: Data Analysis, Data Visualization, Power BI
Searches related to graph analytics
In summary, here are 10 of our most popular graph analytics courses
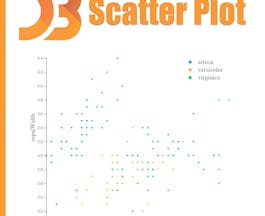
- A Simple Scatter Plot using D3 js: Coursera Project Network
- Data Analysis and Presentation Skills: the PwC Approach: PwC
- Getting started with Google Workspace: Google Cloud
- Data Analysis with Python: IBM
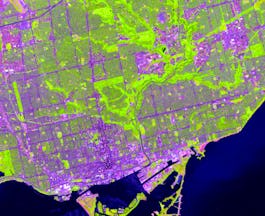
- GIS, Mapping, and Spatial Analysis: University of Toronto
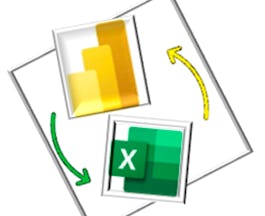
- From Excel to Power BI: Knowledge Accelerators
- Decisions, Decisions: Dashboards and Reports: Google
- From Data to Insights with Google Cloud: Google Cloud
- Visual Elements of User Interface Design: California Institute of the Arts
- Systems Biology and Biotechnology: Icahn School of Medicine at Mount Sinai


